Method
While Not Good Yet
The Ralph loop extends the while loop to questions no machine can settle: a readable chart, a fluent text, an honest forecast. It only works under four conditions and one of them can be counted.
 The Ralph Eyeball Loop, at sprezzature.ai ↗
"While the counter is below ten, go round again." It is one of the oldest sentences in computing. It works for a reason nobody notices any more: the machine knows how to answer the question it is being asked. Comparing a counter to ten costs one clock cycle, a single one of the elementary operations a processor runs through billions of times per second. And the answer is exact. The whole power of the loop sits in that cheap stopping condition.
The questions that decide the quality of a piece of work are not so obliging, far from it. Is this chart readable? Does this paragraph follow from the one before? Does this forecasting model deserve to go to production? None of them settles in a clock cycle, let alone for free. So we pulled them out of our loops and pushed them to the end, into a single review, done by hand, once, by someone who has already worked a lot.
The Ralph loop puts them back. It keeps the skeleton of the while loop, save that a judgement now sits where the test used to be: a human eye, a vision model (an artificial-intelligence program that describes what it sees in an image), a dataset held out on the side. On the face of it, the move looks modest. It changes what can be automated. It also opens a precise trap, and one that takes a number rather than an adjective.
Two materials put the loop to the test, figures and prose. The second holds a surprise: the instrument used there was invented by Mark Twain to mock a translation of his own story, before computer vision borrowed it from him a century later. It comes home here. As for the trap, it has a mechanism of its own: consult the same judge often enough and the loop learns the judge's quirks instead of the subject, which statisticians call overfitting. It takes a number, it shows up on real data and it yields two rules of conduct. An autonomous loop is worth less for the talent of the actor than for the quality of the judge it is given and for being forbidden to corrupt that judge.
The loop in one line
The name comes from the Australian engineer Geoffrey Huntley, who described in July 2025 what he calls the Ralph technique1, after Ralph Wiggum, the Simpsons schoolboy whose answers miss the point with admirable constancy. It fits in one line of shell, the program you type orders into in a terminal:
while :; do cat PROMPT.md | claude-code ; done
Word for word: while true, feed the contents
of the file PROMPT.md to the agent, then start over. You write down in
a file what you want; you feed it in a loop to a coding agent, that is, a language model (the program
behind conversational assistants) allowed here to read and write files and to run commands; you never
let it leave. The surprise is that this produces usable software rather than a heap of incoherent files.
Why does it work? A language model works inside a context window, the amount of text it keeps in view during an exchange. That window is short and degrades as it fills: late in a long conversation, the model loses track of its own decisions. The code repository, the project folder with the history of its versions, does not degrade. On every turn of Huntley's loop, the agent starts from scratch, rereads the real state of the files, does one thing, writes it down. Progress accumulates on disk, never in the model's memory. The forgetting is the feature.
Huntley does not sell his technique as a solution: he writes that it is "deterministically bad in a non-deterministic world," that it only suits a brand-new project, that it demands an experienced engineer at the helm and that its output comes out "undercooked, cooked or cooked with unspecified latent behaviours." He reports a contract billed 50,000 dollars and delivered for 297 dollars of compute; that figure is his and nothing in this article verifies it.
One detail of his command line deserves a
pause, because it is this article's whole subject. while : means
"while true": the condition is empty. The original loop has no test at all; it runs until a human stops
it. Everything interesting begins when you put something back into that condition. Huntley himself
extended the idea in January 2026, arguing the pattern holds for every task2, without giving its
skeleton. That is what the rest of this article tries to do.
The cycle: act, render, judge, decide
A four-step cycle is enough to describe every variant you will meet. Act: produce one change, a single one, so that you later know what to credit for the result. Render: turn that change into an object you can put in front of you and examine, an image, a printed text, a table of measurements; that object is called an artifact. Judge: examine the artifact. Decide: keep or discard, writing down the reason.
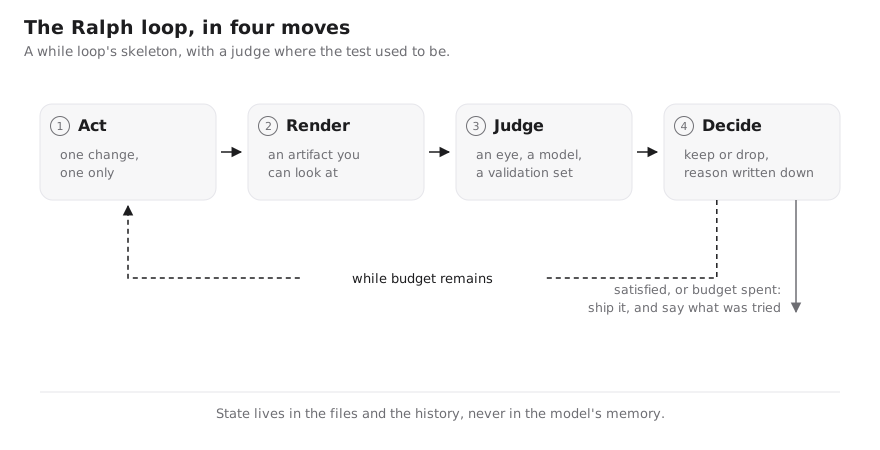
The shared skeleton. The loops described below differ only in what gets rendered and in who does the judging.
The step most often skipped is the second, which is also the one that looks most dispensable. Without a render, the judgement bears on an intention rather than a result; the loop spins without learning anything. The fourth is the one you regret not doing: without a written reason, you will not know, three weeks later, how many ideas were tried before the one that survived. That count of attempts is not paperwork: it is a statistical quantity on which the validity of everything else depends.
The idea is not new, which is rather reassuring: it goes by a different name in every trade. Software engineering has known it for thirty years as the oracle problem, the difficulty of telling correct behaviour from faulty behaviour when no specification does it for you; a 2015 survey concludes that the last source of truth remains the human3. Machine learning rediscovered it through failure: a language model left to its own resources corrects itself poorly and sometimes degrades in the attempt4. A July 2026 survey of 1,250 papers sums everything up in one sentence: every improvement loop is a bet that some signal can stand in for human judgement5. The sturdier the signal, the better the loop, which moves the question from the agent to the judge it is given.
First material: figures
You would expect, in 2026, any model to produce a professional figure unaided. In reality, figures remain among the hardest objects to delegate: an image that came out of a machine is recognizable at first glance. That gap between the promise and the output makes figures the loop's natural first material.
A sentence is checked by reading it again. A chart is not. The code that draws a figure can be entirely correct and the figure wrong all the same: a label sliding out of frame, a legend sitting on top of the data, two points exactly superimposed, a red-and-green palette collapsing into one muddy hue for anyone who cannot tell them apart. None of that shows up when you read the source, only when you look at the rendered result.
That is the discipline the Ralph Eyeball Loop6 formalizes, at sprezzature.ai: render, look, fix the source, repeat, until there is nothing left to spot. The tool converts the source into an image with a deterministic engine, no model and no randomness, so the same source always gives the same image. It then keeps, for each figure, a critique log under eight required headings: composition, contrast, visual hierarchy, spacing, accessibility, colour, label legibility at the size it is rendered and an overall verdict. The log grows with every pass instead of being overwritten: it keeps the history of what was seen and fixed. The sprezzature gallery holds one hundred and twenty-seven kinds of charts, every one of them put through this loop: that is its proving ground.
Who looks? By default, the agent that just wrote the code looks at its own output. An option hands the first pass to a vision model running offline, which a human then rereads. The difference matters, because a machine judge can be measured. A benchmark published in September 2026 took multimodal models, the ones that read images as well as text and put them to work judging charts. It finds systematic weaknesses in them, chief among them a strong tendency to accept everything7. The detail that matters for what follows: models rewarded during training when their answer pleases are the most lenient of all. The judge bends under the very pressure it is supposed to referee. All the same, it is reason enough to keep a human eye in the loop.
A concrete case says it better than a lot of theory. This one comes from this very page. The articles on this blog descend from a layout tool's export. The stylesheet, the file that fixes the page's appearance, declared a spacing between paragraphs that another rule reset to zero. The result: across the eight published articles, blocks of text were touching. Everything was valid, no test failed, no automated audit complained. Someone had to photograph the rendered page and look at it. The same pass surfaced two more defects of the same kind: bibliography numbers sitting on the first letter of their note and stray blank lines between list items. Three defects visible in one second of looking, invisible in any amount of reading the code.
The loop earns its keep where the judge sees what the actor cannot. A person with ordinary colour vision may take all the care in the world; they will never see their own figure the way a colour-blind reader sees it, because the information is not in their eye. A simulator redraws the image as those readers perceive it, then in grayscale. Grayscale is in fact the harshest test of all: a figure that reads in black and white reads under every milder deficiency. If the point survives grey, it survives everyone. And the criterion checks in a second, which makes it a stopping condition almost as cheap as comparing a counter to ten.
Second material: prose
Nothing in this discipline is specific to figures: change the judge in the stopping condition and the same skeleton applies to text. The writing charter this article answers to makes it a rule8. You do not reread a text paragraph by paragraph, but by pairs of consecutive paragraphs, because flow is not decided inside a block: it is decided at the seam. You read paragraph n followed by paragraph n+1 aloud, in one go. You examine the crossing from one to the other. Then you fix the text itself: the order of sentences, the last line of the first, the first line of the second, instead of noting in the margin that "something sticks". Then you slide one notch, to the next pair, and the window starts over.
Because the windows overlap, each paragraph is tested twice, once as an arrival and once as a departure. Reading aloud plays the role of the render here: it turns a text you think you know, since you wrote it, into a signal you receive instead of emit, which is what this article went through.
Here too, the danger has been measured rather than feared. Jane Pan, He He, Samuel Bowman and Shi Feng showed in 2024 that in a loop where the same model writes and grades, the grade climbs while quality as judged by real readers stalls or falls; the effect is worst when writer and grader share their context9. That is the sharpest argument for a reread by someone who did not write the text.
Reading aloud has a blind spot, though. It tests the seam between two paragraphs, which only shows at the crossing from one to the other. It does not test the inside of either. An ambiguous sentence you wrote yourself reads smoothly, because you already know what it means. The ear cannot catch what memory fills in. So a second instrument is needed, working on the same unit but looking elsewhere.
That instrument is called ABABA and the name describes the operation. You write a passage in French, translate it into English, translate it back into French, then start again. A for one language, B for the other. ABABA therefore counts five states, four translations and two full rounds. The word is a palindrome: it reads the same in both directions. That is exactly the property being tested on the text.
Write \(T_{AB}\) for the translation into English and \(T_{BA}\) for the return trip. One full round is their composition \(R = T_{BA} \circ T_{AB}\). The sequence of successive versions is then:
A well-written passage is a fixed point of \(R\): it comes back from the trip intact, because its meaning is carried by its words and not by the reader's goodwill. Machine learning has a name for this property: cycle consistency. It took a hundred-year detour through paintings and horses before coming back to text.
The journey opens on a writer's revenge. In 1903, Mark Twain published his jumping-frog story in three versions: his own, the French translation Thérèse Bentzon had made of it and his own word-for-word retranslation of that French back into English, French syntax and all10. The result is grotesque, which is the point: Twain puts on display what the trip did to his text. The device turned serious in 1970, when Richard Brislin made it the standard quality control of cross-cultural research11. You translate a questionnaire, you translate it back and the gap names the badly worded question before it skews a clinical study.
Next come the horses. In 2017, Jun-Yan Zhu, Taesung Park, Phillip Isola and Alexei Efros set out to turn photographs of horses into zebras12. The difficulty: no matching pairs of photographs exist, so there is no answer key to lean on. Their solution was to require that a round trip give back the starting image. Efros says where the idea came from; the answer closes the circle13: from Mark Twain and from back-translation. He gives the version anyone understands. To have a text rendered into a language you do not know, you pay one translator for the outward leg and a second for the return, then you check that the thing still stands up. Born in text, the technique had left for images; we are bringing it home.
Efros also supplies the image that explains why a round trip teaches you anything. The setup is an autoencoder, the arrangement that compresses a piece of data then rebuilds it, except that here the narrow passage in the middle is not a compression: it is another language. The text is forced through a foreign representation, then back. That passage throws a great deal away. It throws away the turns of phrase that are ours without carrying meaning. It throws away the word order we had thought elegant. Above all, it cannot render an ambiguity: the translator has to pick one reading and fix it.
A sentence that comes back deformed therefore marks a place where the wording does not constrain the reading enough on its own. It may be an ambiguity. It may equally be under-specification, a turn of phrase the target language will not carry, a usage that differs between languages, or simply the translator's preference. The loop does not tell these apart: it points at the spot, and going to look is our job.
It does see what we no longer can, since we already knew what we meant and the translator does not. It is the first naive reader anyone actually has on hand. An unglossed acronym, a term defined nowhere, a pronoun whose antecedent trails three sentences back: none of the three survives the round.
Stability alone proves nothing and Efros says so himself in the same talk. If all you ask is a return to the starting point, the network can cheat by not moving at all: the identity map cycles perfectly. A second constraint had to be added, demanding that a translated horse really look like a zebra. The measured version of that cheat arrived the same year. Casey Chu, Andrey Zhmoginov and Mark Sandler showed that CycleGAN learns to hide the source image inside an imperceptible noise added to its own output14. The cycle closes flawlessly without anything having been translated. They called it steganography, the art of concealing a message inside an innocuous-looking carrier.
Hence a two-part criterion, neither part optional. Stability is measured against the previous round: is the text still moving? Fidelity is measured against the original, always, never against the previous round. In practice you list the claims made by the starting text, list those made by the arriving text, then compare the two lists. There is a reason for that asymmetry. A drift in meaning advances through links that are invisible one at a time and considerable once composed. It also conceals itself: by the second round the text has become coherent with its own error.
This article's central trap returns here in a sharp form. \(R\) has an attractor, that is, a state the repetition pulls the text towards whatever its starting point. That attractor is the translator's average prose. Iterating to convergence means arriving there: flattened vocabulary, dead rhythm, bolted-on transitions. The loop clarifies and flattens in one motion, without being able to separate the two. A neighbouring phenomenon has been measured elsewhere. Ilia Shumailov and his coauthors showed in 2024 that a model retrained on its own outputs first loses the tails of its distribution, that is, whatever was rare in it15. The analogy has a limit worth stating: their loop retrains the model, ours only queries it. What grows poorer here is not in the weights, it is in the text.
The remedy is simple: never keep the loop's output; keep as a map whatever moves from one round to the next. The passages that refuse to settle are the badly written ones; you rewrite those by hand. Instability is the signal; the fixed point is not. If a round turns "X" into "Y", the useful information is not Y. It is that X was rewritable, so a reader could read it as Y. That was all we wanted to know. What comes next is written in our own hand, which protects the register.
Alternating the translators costs little; Twain and Efros already prescribed it by hiring two different people. With a single model the fixed point is its own style; with two models in alternation, a text that settles has to satisfy both models' preferences rather than one's, which pulls it away from either one's habits. The picture is an intuition, not a proved property of the system. The language you pass through deserves the same care. French and English share too much Latin machinery: a calque slips across unresisted and a badly built French sentence stays badly built in English without anything sounding wrong. For diagnosis, a structurally distant language such as Japanese or Finnish forces a real re-encoding.
A serious objection belongs here rather than under the rug. Harold Somers showed in 2005 that the round trip is a poor way to grade a machine translator16: errors on the way out and errors on the way back cancel each other, so a successful round proves nothing about the quality of either translation. The objection is sound and does not apply here, because the unknown has moved. Somers varies the translator and holds the text fixed, since he wants to grade the translator. We do the opposite: the translator is held fixed and assumed good; it is the text that varies.
Two recent measurements confirm that the thing can be measured when approached this way. Jihyung Moon, Hyunchang Cho and Eunjeong Park showed in 2020 that the round trip predicts quality well, provided you compare meanings rather than words17. In April 2026, Ronald Skorobogat, Ameya Prabhu and Matthias Bethge measured a correlation of 0.94 between a round-trip score and the preferences of real users, where two established multilingual benchmarks fall to zero or turn negative18. The error cancellation Somers describes remains a good reason never to conclude from a single round with a single model.
Two instruments, then, on the same unit of text. The ear tests the seam, translation tests the inside. You read aloud first, because it is free and settles half the problems. You launch the round trip only on the pairs that resist and never more than two rounds on a passage that yields. Past five, you are measuring the attractor and not the text.
The trap: the judge ends up bought
A loop optimizes what it measures. Put a judge into the stopping condition and the loop starts optimizing the judge. Charles Goodhart observed it in 1975 on British monetary policy: a statistical regularity collapses as soon as it is used as a target19. The anthropologist Marilyn Strathern gave it in 1997 the wording that stuck, while studying university assessment: when a measure becomes a target, it ceases to be a good measure20. The modern, measured version, on language models: Leo Gao, John Schulman and Jacob Hilton optimized harder and harder against an artificial judge; the awarded score climbs without pause, while true quality climbs, plateaus, then falls21. The judge does not break at once: it bends as you push, which is far harder to notice.
In a Ralph loop, that corruption can be priced. Take a forecasting model being improved by iterations. On each turn, the agent proposes a change; you measure it on a validation set, data held out on the side, never used for training and only for arbitration. That measurement is noisy, like every measurement made on a finite sample: redone on other data, it would move. Call \(\sigma\) its standard error, the typical size of those fluctuations. The ideas, for their part, have real effects, sometimes good, sometimes bad, with typical spread \(\tau\). You try \(K\) ideas and keep the one that measures best.
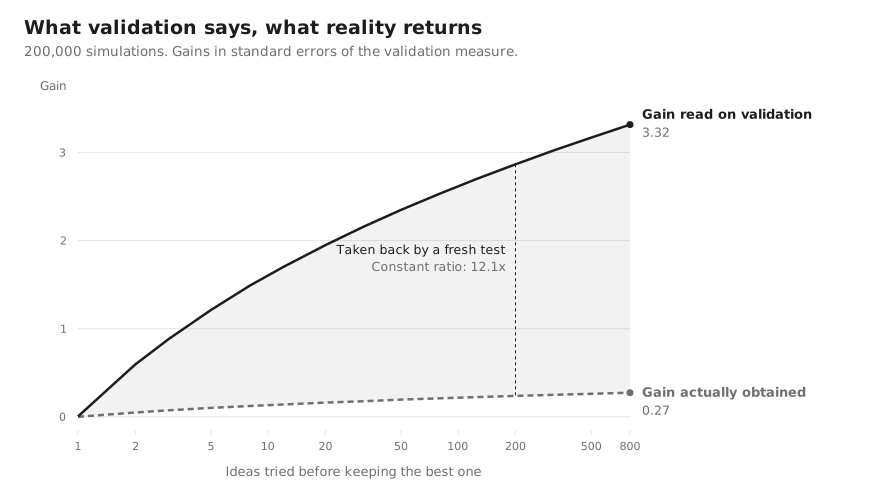
Two hundred thousand simulated draws, with measurement noise three and a half times the spread of the true effects. The upper curve is what validation announces; the lower one is what survives being measured elsewhere.
The simulation above takes measurement noise three and a half times larger than the gap between a good idea and a bad one, which is nothing extravagant in practice. After eight hundred ideas tried, the winning change shows a validation gain of 3.32 standard errors. Its true gain is 0.27: twelve times less. The gap between the two curves is exactly what going to production always claws back.
Nothing accidental there. The intuition fits a schoolroom scene: the student who takes the top mark in a competitive exam has, in general, both ability and luck, because selecting the best paper also selects the luck. The best estimate of their true level is therefore a little below their mark. The law that prices this discount fits in a formula: given a measurement \(m\), the best estimate of the true effect \(\theta\) behind it is not \(m\) but a version shrunk toward zero, the more so as the measurement is noisy:
This is the Bayesian shrinkage formula, from the same family of ideas as the estimators popularized by James and Stein in the 1950s22 and which Bradley Efron tied in 2011 to selection bias itself23: a value picked because it was the largest systematically overstates what it measures. With the simulation's values, the factor is 12.1: whatever validation announces, divide it by twelve. The number of ideas tried does not change that factor; it changes the size of the mirage, which grows like \(\sqrt{2\ln K}\), a function that climbs very slowly but never stops. A loop left running therefore ends up announcing an arbitrarily large gain on its judge, without having improved anything. The same mechanism explains why so many published results fail to replicate, as John Ioannidis showed in 200524. Petroleum economists had named it as early as 1971, observing that the winner of an auction is the bidder who most overestimated the tract: the winner's curse25.
One limit, stated plainly: this calculation is a simulation assuming independent ideas with no average talent. That is pessimistic for a competent engineer, whose proposals are not drawn at random; optimistic for an agent producing twenty variants of the same idea. It is a model of the mechanism, not a verdict on any particular loop. What survives the caveats fits in one sentence: what you read exceeds what you get; that gap widens with every extra try.
The same thing, on real data
A simulation is still a simulation. Here is
the same experiment on real data; it is harsher than the model. Eight hundred images of handwritten
digits, cut in two. Four hundred serve the judge, a cross-validation whose workings the next section
explains; the other four hundred form a frozen test the loop never sees. On each turn, the loop proposes
a small change to the input variables, accepts it if the validation score rises, rejects it otherwise.
Two hundred proposals examined, ten accepted. The full protocol is given so it can be redone rather than
believed, seed included. The seed is the number that pins down the randomness: anyone rerunning the
program gets exactly the same experiment. The load_digits dataset from
scikit-learn, seed 20260922, logistic regression, five-fold cross-validation.
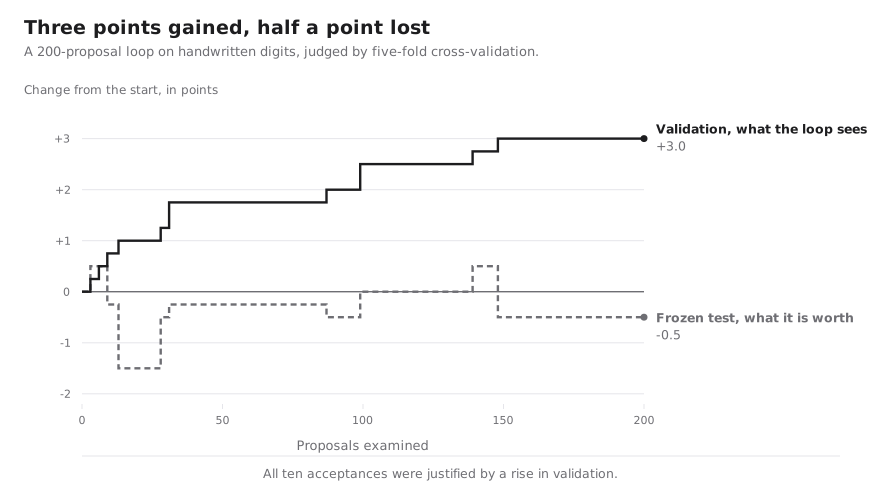
Every step of the upper curve is a change accepted because it had raised validation. The lower curve says what those ten decisions were worth.
Validation gains three points, in ten steps, each one justified by a measured rise. The frozen test loses half a point. The whole announced progress was noise the loop chased. The important point is not that the loop failed here: it is that it failed exactly the way it would have succeeded. Its validation curve climbs in steps, like the curve of a loop that is genuinely winning. From the inside, the two situations cannot be told apart, try as you might. Only a frozen set separates them, consulted once.
A second objection weighs more than the first. The largest empirical check points the other way: Rebecca Roelofs and her coauthors compared, across more than a hundred Kaggle competitions, the public leaderboards, built from thousands of submissions, against the private leaderboards revealed once at the end; they found little overfitting29. The explanation fits in two words: effective multiplicity. Twenty variants of one idea do not count as twenty independent tries. The handwritten-digits experiment draws nearly independent tries: it is the unfavourable case, chosen as such. The useful question is therefore not whether a loop overfits, but how many genuinely distinct tries it has made.
The budget or what makes a number believable
Should you then give up searching in a loop? No; a comparison shows why. The classic reflex for tuning a model is the grid: enumerate combinations of settings fixed in advance, evaluate them all, keep the best. James Bergstra and Yoshua Bengio showed in 2012 that at equal budget, drawing the combinations at random already beats a regular grid26. A Ralph loop goes further: its next proposal depends on what the previous measurement said. Statisticians call that adaptive analysis and distrust it for good reason, because a validation set wears out much faster under questions that depend on the answers already obtained; Cynthia Dwork and her coauthors built quantified guarantees for that case27. You would therefore expect the loop to do worse than the grid. The simulation says the opposite.
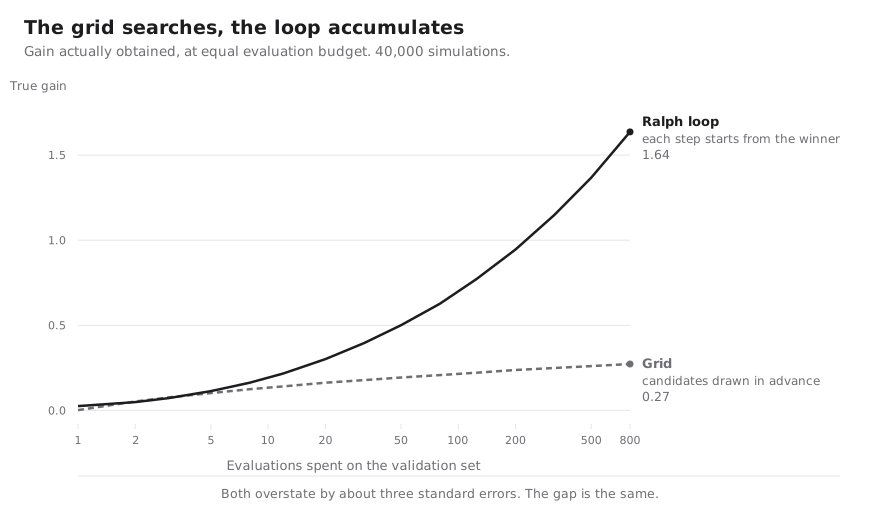
Same judge, same evaluation budget, two ways of searching. The grid draws every candidate from scratch; the loop restarts each time from the previous winner.
At equal budget, the grid obtains a true gain of 0.27 standard errors, the loop 1.64: six times more. Where does the advantage come from? A third experiment settles it; it plays the role of the control group in a drug trial. The same step-by-step walk, but accepting everything without ever looking at the measurement, brings nothing: so it is the selection that does the work, not the accumulation alone. Conversely, the same walk judged by an oracle that could see the true effects would gain sixty times more: the loop, with its noisy judge, recovers only two percent of what was available. As for the mirage, it is identical on both sides: grid and loop overstate their gain by the same amount. The inflation does not depend on how you search, only on how many times you consulted the judge.
From this comes a budget rule, whose address deserves to be given precisely, because it is not mine. In 2014, David Bailey, Jonathan Borwein, Marcos López de Prado and Qiji Zhu treated this exact problem for financial backtests, the simulations that replay an investment strategy on the past28. Their result: below a certain amount of data, a flattering track record proves nothing; with five years of history, you should not try more than forty-five independent configurations. Carried over to a loop that tolerates an optimism of \(\delta\) standard errors, the same bound gives a cautious rule:
Cautious, because the formula overshoots: the exact calculation allows about three tries for a tolerance of one standard error, twenty-seven for two, four hundred and forty-three for three, where the formula concedes only one, seven and ninety. And \(K\) must be counted in genuinely distinct tries, not in loop turns. What survives every caveat, and has been proven since 2014 in an entirely different field, fits in one sentence: capping the number of turns is not a compute saving, it is the condition for the final number to mean anything. A loop without a budget ends up reporting what you hoped to hear.
What really tips the scale toward the loop is not the factor of six anyway. It is that a grid assumes you can list the candidates in advance. The changes that matter cannot be listed: adding a derived variable, changing the loss function, fixing a data leak. You cannot put those in a grid, for want of being able to write its axes. The loop searches where there is no grid to draw: that is its irreplaceable advantage. The rest has a price.
The everyday judge: cross-validation
Everything above rests on \(\sigma\), the judge's noise. In a real project, that quantity gets set without anyone noticing, at the moment the data split is chosen. The standard tool is cross-validation: split the dataset into \(k\) parts, the folds; train on \(k-1\) folds, measure on the last and start again \(k\) times, changing the held-out fold each time. You then quote the mean of the \(k\) scores, with an error bar.
That bar is almost always too optimistic, for a simple reason: the calculation treats the \(k\) measurements as independent, when two folds share nearly all their training data. Gaël Varoquaux documented the size of the problem: on small samples, published bars are routinely too narrow by half30. On the handwritten-digits example, the variability that matters, from one sample to the next, is nearly double the between-fold spread everyone quotes. Underestimating \(\sigma\) by a factor of two means underestimating \(\sigma^{2}\) by a factor of four, hence believing in four times more progress than there is. The split is not a logistical detail: it sets the exchange rate between what you read and what you get.
That is what the tool suite published by probabl around scikit-learn, skrub and skore codifies31: a split by groups when several rows come from the same subject, a chronological split with a buffer zone when time order matters and an explicit warning against the habits that produce overconfident bars. The suite reads like a Ralph loop written out in full: state lives in a logbook, the judge is a report distinct from whoever wrote the pipeline, every proposal arrives with its written reason and several steps stop dead rather than carry on over a missing dependency.
One detail there deserves copying everywhere. Its smoke test is not a judgement, it is an exact assertion: the number of predictions must equal the number of rows to predict. It catches one precise, frequent fault. There is a judgement turned back into a cheap test. Every Ralph loop gains from manufacturing as many of these as it can: whatever the machine can settle has no business sitting in the expensive condition.
Forecasting without cheating
This section describes a project just starting, proposed to two students of the specialized master's in artificial intelligence at CentraleSupélec by Marianne Clausel, of the Université de Lorraine, Georges Oppenheim and myself. It concerns forecasting financial series; its evaluation protocol is called LookForward. The rule is short: at each date you forecast from, the origin, the model uses only the information available on that date, predicts the next steps, then the origin advances one notch. A forecast evaluated on data it has already seen is not a forecast, it is an interpolation. The difficulty is not in the model, it is in the calendar: an indicator published on the fifteenth cannot serve a forecast made on the tenth.
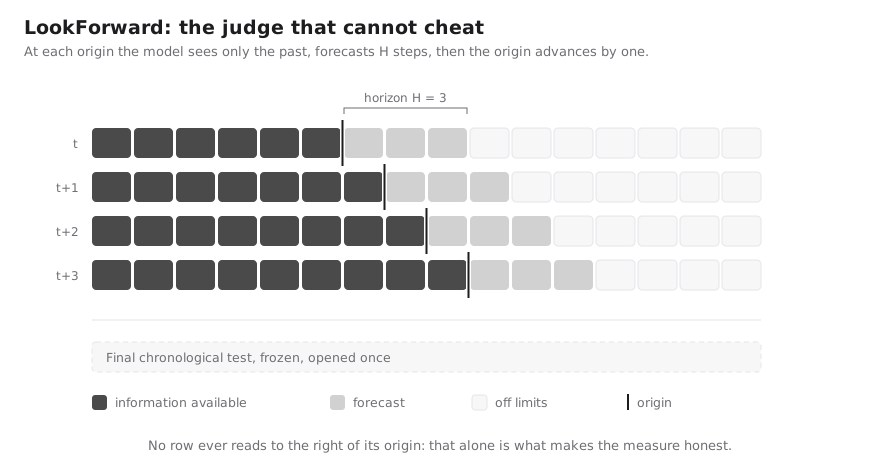
LookForward. The judge is not a randomly drawn dataset but a discipline of the calendar: no row ever reads to the right of its origin.
Finance is the very field where Bailey and his coauthors showed that with enough tries, you get a flattering track record for any strategy, even one with no predictive power at all28. Hence the protocol's shape. A Ralph loop under budget tests each change in rolling validation, then accepts or rejects it while recording the reason. Kept apart from all of it, a final chronological test, frozen, opened once, yields the number that will be published. The budget caps the \(K\) of the formula; the recorded reason makes it auditable; the frozen test keeps the factor of twelve from slipping by unnoticed.
The project compares three families: classical statistical methods, machine-learning methods and time-series foundation models, those large models already trained on huge collections of series and reused as they are. It follows the open protocol TFB32, with Chronos and TimesFM among the candidates33, 34. Nothing in it presumes that a recent model beats the most naive forecast there is: tomorrow will be worth what today is worth. It finally allows itself a rare exit: abstention, backed by conformal risk control35, whose guarantee rests on an assumption that financial series strain; the project sheet says so itself. It is the same restraint that elbow-helper applies to curve elbows: better to stay silent than to assert without proof.
One detail of the deliverables sums up everything above. The sheet asks that the figures' legibility be audited with the Eyeball approach, separately from the numerical validation of the forecasts. Two different questions, two different judges. Confusing them means asking a score to tell you whether a chart is readable or an eye to tell you whether an interval covers.
One cycle across four materials
| Loop | What gets rendered | Who judges | How the judge gets bought | The guard |
|---|---|---|---|---|
| Code | The repository after one turn | The test suite, then a human | Tests become the target; code passes without being right | Tests written first, by someone else |
| Figures | An image, always the same for a given source | An eye or a vision model | You get used to your own figure and stop seeing it | Grayscale, colour-vision simulation, a fresh pair of eyes |
| Prose | The text read aloud, then translated and translated back | The ear for the seam, a translator for the inside | The text converges on the translator's average prose | Keep the diff and not the output, alternate translators |
| Forecasting | Dated errors, horizon by horizon | A rolling validation | The more you consult a validation set, the more it wears out | A budget, a recorded reason, a frozen test |
One cycle across four materials. The fourth column is the same sentence every time, spoken in four languages.
Where the idea comes from and what this article adds
A clarification, because the word is starting to mean everything. Iterating through production, critique and correction is in no way specific to Ralph and predates it: Self-Refine has the model critique itself36; Reflexion keeps a memory of comments from one attempt to the next37. What is specific to Huntley's technique is a combination: a fresh context on every turn rather than a lengthening conversation, durable state outside the model, real execution of the code produced, one single thing done per turn. As for the loops on prose, figures and forecasting described above, they are my generalization of the pattern, not an established sense of the term: a reader searching for "Ralph loop" elsewhere will find code and nothing else.
None of the numbered part is mine either. Quantitative finance proved in 2014 that selecting among \(N\) backtests imposes a minimum length of history28. Theoretical computer science proved in 2015 that a held-out set only survives a bounded number of adaptive questions27. The alignment community measured, between 2022 and 2024, that pushing too hard against a stand-in judge destroys real quality21. Shrinkage toward the mean dates from the 1950s. Meanwhile, in 2025, software engineering put into production a loop with no stopping condition at all. These literatures do not cite one another. This article's only contribution is to say that they describe the same object and that the budget rule holds for agent harnesses exactly as it does for market strategies.
The guards
The cycle comes with four guards, checked before anything is launched. State lives outside the model, in files and version history, never in a conversation. The judge is independent of the actor: the eye that evaluates is not the hand that drew, the validation set is not the training set. A budget caps the number of turns. Every turn leaves a written reason, lest the \(K\) of the formula be lost and the final gain with it. And abstention is a legal exit, on the same footing as success: a loop that is not allowed to conclude it found nothing will always find something.
Those four guards amount to a working definition, one that fits on a line and serves better than the word "loop" on its own. A good agent loop is not a "retry until it passes". It is an adaptive search with persistent state, under an outside oracle, with an explicit budget and a right to abstain. Each of the four terms answers to one of the guards, and dropping any one of them makes the final number unverifiable.
They also obey one principle, which Efros puts better than I can in the talk already cited13. You do not build an incorruptible judge: no such thing exists. The data is finite, so there will always be some path for cheating; plugging one hole opens another. What you can do is arrange the problem so that cheating costs more than working. He uses the image of a well-run country: you can break the law there, you simply have no interest in doing so. In a badly run country, cheating is the rational calculation and everyone cheats.
His schoolroom example comes from his own classroom. A whole semester of work is expensive; memorising last year's past papers is cheap, yet it often suffices to pass the exam. The student who does this is not dishonest, only rational: it is the exam that is badly built. A validation set consulted two hundred times is exactly those past papers. The budget, the written reason and the frozen test do not moralise the loop; they raise the price of cheating until working becomes the cheapest road again.
One last thing: where the analogy with the while loop finally gives way. A classic loop that fails to stop is noticed immediately: the machine heats up and nothing comes out. A Ralph loop that fails to stop produces plausible work on every turn, a slightly different figure, a slightly reworked paragraph, a slightly better score. It does not look like a breakdown. It looks like progress. That is exactly what makes it dangerous.
Hence the closing recipe: render what you just made, actually look at it, fix the source and not the image, count your turns. The first three steps cost seconds. The fourth is the one everyone forgets and the only one the other three depend on. Because an autonomous loop is not worth the quality of its actor: it is worth the evaluation architecture it is forbidden to overfit.
Bibliography
Every title below went into writing one particular section; the note says which. None is cited second-hand.
- Huntley, G. (2025). Ralph Wiggum as a "software engineer". ghuntley.com/ralph The page that names the technique and gives its shell line. The author also states the caveats quoted here: greenfield only, a senior engineer required, output whose doneness is not guaranteed. It carries no stopping condition at all: the operator decides. The cost figure cited is his.
- Huntley, G. (2026). everything is a ralph loop. ghuntley.com/loop Argues the pattern holds for all tasks and sketches several orchestration variants. It is the most direct antecedent of the generalization defended here; generality is asserted rather than structured, with no common skeleton and no failure-mode analysis.
- Barr, E. T., Harman, M., McMinn, P., Shahbaz, M. and Yoo, S. (2015). "The Oracle Problem in Software Testing: A Survey," IEEE Transactions on Software Engineering, 41(5), 507-525. 10.1109/TSE.2014.2372785 Surveys thirty years of attempts to decide automatically whether observed behaviour is correct and concludes that where specifications, models and metamorphic testing stop, the last source of oracle information remains the human. This is software engineering's statement of the problem, long predating agents.
- Huang, J., Chen, X., Mishra, S., Zheng, H. S., Yu, A. W., Song, X. and Zhou, D. (2024). Large Language Models Cannot Self-Correct Reasoning Yet, ICLR. arxiv.org/abs/2310.01798 Separates self-correction from the model's own resources alone from correction leaning on an outside signal and shows the former fails, performance sometimes degrading after correction. It is the empirical case for the judge coming from somewhere other than the actor.
- Chen, M., Wang, L. and Qu, B. (2026). Recursive Self-Improvement in AI: From Bounded Self-Refinement to Autonomous Research Loops. arxiv.org/abs/2607.07663 A survey of 1,250 papers holding that every improvement loop is a claim that some signal can substitute for human judgement and ranking those signals from formal verifier to intrinsic self-assessment. It is the closest statement to this article's framing and it came first of the two by several months.
- Harchaoui, W. The Ralph Eyeball Loop, Sprezzature. sprezzature.ai/ralph-eyeball-loop.html Applies the loop to visual artifacts and separates three complementary passes: make it from code, audit the source, look at the render. It is the source of the four steps, the eight critique headings and the argument for grayscale as the severest test.
- Wu, L., Zhao, H. H., Zhang, Z., Tang, J., Wu, J. and Wang, A. J. (2026). ChartJudgeBench: Evaluating LMM Judges for Chart-to-Code Generation. arxiv.org/abs/2609.24210 Evaluates multimodal models used as chart judges and documents four systematic weaknesses, among them a marked tendency to accept and greater leniency in reinforcement-trained models. It is the measurement of the visual judge the figure loop depends on.
- Harchaoui, W. WRITING.md, a writing charter for English prose. gist.github.com Section 10 carries the loop over to prose: rereading by pairs of consecutive paragraphs, overlapping sliding windows, fixing the text rather than the impression. It is the charter this article applies to itself.
- Pan, J., He, H., Bowman, S. R. and Feng, S. (2024). Spontaneous Reward Hacking in Iterative Self-Refinement. arxiv.org/abs/2407.04549 Shows that in a loop where one model both writes and grades, the grade rises while quality as perceived by real readers stalls or falls, the more so when writer and grader share context. The failure mode described here was therefore already named and measured on prose.
- Twain, M. (1903). The Jumping Frog: In English, Then in French, Then Clawed Back into a Civilized Language Once More by Patient, Unremunerated Toil, Harper & Brothers. Twain prints his story, the French translation Thérèse Bentzon made of it and his own word-for-word retranslation, side by side. The demonstration is comic and exact: the round trip makes visible whatever was fragile in the text. It is the literary ancestor of the loop described here.
- Brislin, R. W. (1970). "Back-Translation for Cross-Cultural Research", Journal of Cross-Cultural Psychology, 1(3), 185-216. 10.1177/135910457000100301 Establishes back-translation as quality control in cross-cultural research; it has been the standard procedure ever since for translating a clinical or psychometric questionnaire, where one lost nuance skews a whole study. It settles that the return gap is an exploitable signal rather than noise.
- Zhu, J.-Y., Park, T., Isola, P. and Efros, A. A. (2017). "Unpaired Image-to-Image Translation using Cycle-Consistent Adversarial Networks", ICCV, 2242-2251. arXiv:1703.10593 CycleGAN: with no matching image pairs available, the training constraint becomes the round trip itself. It is the formalization of cycle consistency used here, together with the proof that it can stand in for a missing answer key.
- Efros, A. A. (2018). Self-supervision, Meta-supervision, Curiosity: Making Computers Study Harder, lecture at CIIRC, Czech Technical University in Prague, 25 May 2018. youtube.com/watch?v=_V-WpE8cmpc Efros explicitly credits CycleGAN's idea to Mark Twain and back-translation and describes the setup as an autoencoder whose narrow passage is another language (at 48 min). He also states the limit taken up here: without a second constraint, the network cheats by not moving. And the formulation that carries the end of this article: make cheating more expensive than doing the work.
- Chu, C., Zhmoginov, A. and Sandler, M. (2017). CycleGAN, a Master of Steganography, "Machine Deception" workshop, NIPS. arXiv:1712.02950 Shows that CycleGAN conceals the source image in an imperceptible high-frequency noise, which lets it reconstruct exactly without having translated anything. It is the demonstration that cycle consistency alone is degenerate. Hence fidelity is measured here against the original, never against the previous round.
- Shumailov, I., Shumaylov, Z., Zhao, Y., Papernot, N., Anderson, R. and Gal, Y. (2024). "AI models collapse when trained on recursively generated data", Nature, 631, 755-759. 10.1038/s41586-024-07566-y Measures what becomes of a model retrained on its own outputs: the tails of the distribution go first, which is to say whatever was rare. Cited here as a measured analogue of the attractor, with its limit stated plainly: theirs is a retraining loop, not a querying loop.
- Somers, H. (2005). "Round-trip Translation: What Is It Good For?", Australasian Language Technology Workshop, 127-133. aclanthology.org/U05-1019 The substantive objection: the round trip grades a machine translator very poorly, since errors on the outward and return legs cancel. Taken up here rather than set aside; it does not target the same use, but it directly motivates alternating translators.
- Moon, J., Cho, H. and Park, E. L. (2020). "Revisiting Round-Trip Translation for Quality Estimation", EAMT. arXiv:2004.13937 Rehabilitates the round trip by changing what gets compared: meaning embeddings instead of word overlap. It is the technical answer to Somers, hence the justification for the fidelity criterion used here, which bears on claims and not on form.
- Skorobogat, R., Prabhu, A. and Bethge, M. (2026). Round-Trip Translation Reveals What Frontier Multilingual Benchmarks Miss, 14 April 2026. arXiv:2604.12911 Measures a correlation of 0.94 between a round-trip score and user preferences, where two established multilingual benchmarks fall to −0.09 and −0.26. It is the most recent evidence that the round trip catches something real. It bears on models rather than on text, so it supports the use made here without proving it.
- Goodhart, C. A. E. (1975). "Problems of Monetary Management: The U.K. Experience," Papers in Monetary Economics, Reserve Bank of Australia. The original observation, made on British monetary aggregates: a statistical regularity stops holding once it is used as a policy target. It grounds the section on the corruption of the judge.
- Strathern, M. (1997). "'Improving ratings': audit in the British University system," European Review, 5(3), 305-321. Supplies the short formulation that became proverbial, out of ethnographic fieldwork on university assessment. Cited for the exact wording rather than through a secondhand quotation.
- Gao, L., Schulman, J. and Hilton, J. (2023). "Scaling Laws for Reward Model Overoptimization," ICML, PMLR 202, 10835-10866. arxiv.org/abs/2210.10760 Has a reward model stand in for the human judge and measures what happens as you optimize against it: the score climbs, true quality plateaus then falls, along a fitted functional form. Goodhart's law made quantitative, on a material this article does not otherwise treat.
- Efron, B. and Morris, C. (1977). "Stein's Paradox in Statistics," Scientific American, 236(5), 119-127. An accessible account of shrinkage toward the mean: a value picked because it was the largest overstates what it measures. How much to take back depends on the ratio of noise to real spread. That is the boxed formula in this article. It dates from the 1950s.
- Efron, B. (2011). "Tweedie's Formula and Selection Bias," Journal of the American Statistical Association, 106(496), 1602-1614. 10.1198/jasa.2011.tm11181 Ties shrinkage explicitly to selection bias: the largest few estimates overstate their parameters, with the correction written from the observed marginal density. It is the exact address of the factor used here.
- Ioannidis, J. P. A. (2005). "Why Most Published Research Findings Are False," PLoS Medicine, 2(8), e124. 10.1371/journal.pmed.0020124 Makes quantitative the link between the number of hypotheses explored and the probability that a reported result is false. Same mechanism as the one simulated here, applied to the scientific literature.
- Capen, E. C., Clapp, R. V. and Campbell, W. M. (1971). "Competitive Bidding in High-Risk Situations," Journal of Petroleum Technology, 23(6), 641-653. Origin of the phrase "winner's curse," on auctions for oil tracts: the winner is the bidder whose estimate was highest, hence most wrong. The same structure as selection on a validation set.
- Bergstra, J. and Bengio, Y. (2012). "Random Search for Hyper-Parameter Optimization," Journal of Machine Learning Research, 13, 281-305. jmlr.org/papers/v13/bergstra12a Shows that at equal budget, drawing settings at random beats a regular grid, because performance depends strongly on only a few settings and a grid repeats its trials on the others. It is the comparison baseline for the model-selection section.
- Dwork, C., Feldman, V., Hardt, M., Pitassi, T., Reingold, O. and Roth, A. (2015). "The reusable holdout: Preserving validity in adaptive data analysis," Science, 349(6248), 636-638. 10.1126/science.aaa9375 Separates questions posed in advance from questions depending on answers already obtained and builds a mechanism restoring quantified validity to a holdout under adaptive querying, at the cost of an explicit budget of disagreements. It is the theoretical-computer-science proof that the budget is a necessity, not a prudence.
- Bailey, D. H., Borwein, J. M., López de Prado, M. and Zhu, Q. J. (2014). "Pseudo-Mathematics and Financial Charlatanism: The Effects of Backtest Overfitting on Out-of-Sample Performance," Notices of the American Mathematical Society, 61(5), 458-471. 10.1090/noti1105 Computes the expected maximum of \(N\) skill-free trials, bounds its growth by \(\sqrt{2\ln N}\) and derives a minimum-backtest-length theorem. It is the source of this article's budget rule, which only carries it across; the precedence is total, the bound itself coming from extreme-value theory.
- Roelofs, R., Shankar, V., Recht, B., Fridovich-Keil, S., Hardt, M., Miller, J. and Schmidt, L. (2019). A Meta-Analysis of Overfitting in Machine Learning, NeurIPS. Compares, across more than a hundred Kaggle competitions, public leaderboards built from thousands of submissions against private leaderboards revealed once: the observed overfitting is small, if anything. It is the empirical counter-evidence to the worst-case theory and the reason to speak of effective multiplicity rather than of turn count.
- Varoquaux, G. (2018). "Cross-validation failure: Small sample sizes lead to large error bars," NeuroImage, 180, 68-77. 10.1016/j.neuroimage.2017.06.061 Shows the standard deviation across folds strongly underestimates the real uncertainty of a cross-validated estimate, enough to cast doubt on published comparisons, with bars around ten points for a hundred samples. It justifies the decomposition measured here.
- probabl (2026). skills, agent skills for scikit-learn, skrub and skore, BSD-3-Clause. github.com/probabl-ai/skills A suite chaining exploration, construction, smoke test, evaluation and audit, with an outer loop that sources the next experiment. It serves here as an example of a Ralph loop whose judge and stop conditions are written down, notably its decision tree for choosing a splitter.
- Qiu, X. et al. (2024). TFB: Towards Comprehensive and Fair Benchmarking of Time Series Forecasting Methods. arxiv.org/abs/2403.20150 An open benchmarking protocol for time-series forecasting, built to avoid comparisons skewed by uneven tuning. It is the evaluation frame the project described here adopts.
- Ansari, A. F. et al. (2024). Chronos: Learning the Language of Time Series. arxiv.org/abs/2403.07815 A foundation model that treats a numeric series as a sequence of tokens, the way a language model treats text. A candidate in the comparison, with no presumption of superiority.
- Das, A. et al. (2024). A decoder-only foundation model for time-series forecasting. arxiv.org/abs/2310.10688 The other family of pretrained models in the comparison, trained on a large corpus of series to forecast without refitting. Its size makes it the project's CPU-feasibility test.
- Angelopoulos, A. N., Bates, S., Fisch, A., Lei, L. and Schuster, T. (2022, revised 2025). Conformal Risk Control. arxiv.org/abs/2208.02814 Extends conformal prediction to risk notions broader than coverage rate, with a guarantee that holds on average under exchangeability. That is the assumption the dependence of financial series puts under strain, as the project sheet acknowledges.
- Madaan, A., Tandon, N., Gupta, P., Hallinan, S., Gao, L., Wiegreffe, S. et al. (2023). Self-Refine: Iterative Refinement with Self-Feedback, NeurIPS. arxiv.org/abs/2303.17651 A loop where one model produces, critiques its own output, then corrects it, with no external signal. It predates the Ralph technique and establishes that critique-and-correct iteration is in no way specific to it.
- Shinn, N., Cassano, F., Berman, E., Gopinath, A., Narasimhan, K. and Yao, S. (2023). Reflexion: Language Agents with Verbal Reinforcement Learning, NeurIPS. arxiv.org/abs/2303.11366 Keeps a memory of natural-language comments across attempts, standing in for a learning signal. A second antecedent showing that memory between turns also predates the Ralph technique.
Two trails to keep going. My favourite AI books, for the annotated survey. The sprezzature gallery, to see what a body of figures looks like once every one of them has been through the loop.